Intraday Open High Open Low Trading Strategy
OPEN HIGH LOW STRATEGY
Intraday Open High Open Low Trading Strategy
The original name of the strategy is open deive. From a buy-sell perspective, we called it open high and open low.
Open high= sell
Open low= buy
So open rive and open high open low are both the same.
The logic behind the strategy
These are directional moves with strong hand participation and conviction.
Where does it occur? Location
It occurs most of the time after a sideways price action (tight price channel), or You can also spot it at the start of a trading session. From a strong supply or demand zone
If open-drive occurs after a sideways price action, it indicates that either strong buyers or sellers were accumulating their positions in the sideways price action, or afterward, they started aggressive buying or selling activity to move the price
If at the start of a trading session. An Open-Drive is generally caused by participants who have made their market decisions before the opening bell. The market opens and moves aggressively in one direction. Fueled by strong smart money activity, the price never returns to trade back through the opening range
The rule for selling open drive or open high strategy
Where is the action playing out? (location in the big picture). Reason to take the trade. Best work if a breakout from any sideways price action is or gap from a strong supply or demand zone
First, 5 min candle(opening candle) should be a big red candle Open = High, For easy reference 2-3 points buffer will be considered as equal not carrying much weight
The first candle opens to close around the lower of the candle (preferably)
Volume must be high
Minimum Risk: Reward(R: R)=1:2(next support area)
Breakout entry after opening range or first candle low(for open high set up)
The price must be below vwap for sell
Let’s do it as an example
Open high strategy for entry
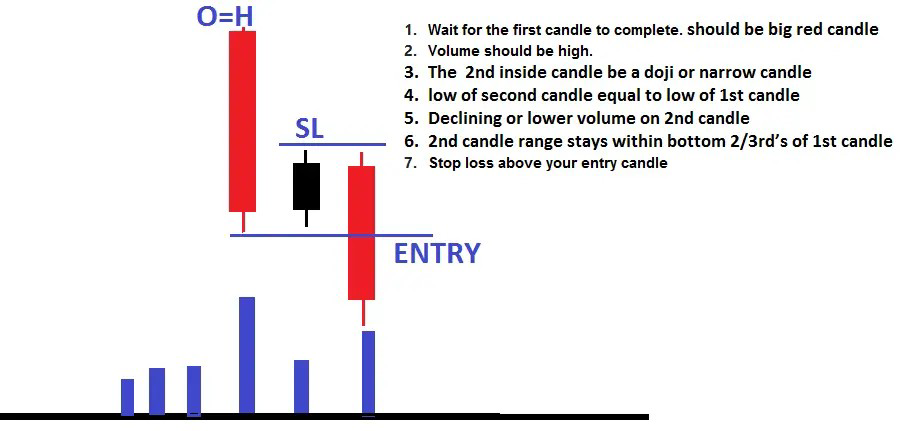
Wait for the first candle to complete. should be a big red candle
Volume should be high.
1 The 2nd inside candle be a Doji or narro candle
2 low of second candle equal to low of 1st candle
3 Declining or lower volume on 2nd candle
4 2nd candle range stays within the bottom 2/3rd of 1st candle
5 The price must be below vwap
Stop loss above your entry candle or day high as per your risk
Let’s do an example
Today I took this

a daily time frame, the price increases with volume decreasing and closing near resistance. I clearly indicate me this move will not break the
Refrance
Today price gap is up to resistance. Then wait for 1st candle to complete
What first candle told me?
1 A big red candle
2 Open = High
3 First candle opens to close around the lower of
the candle
4 Volume very high

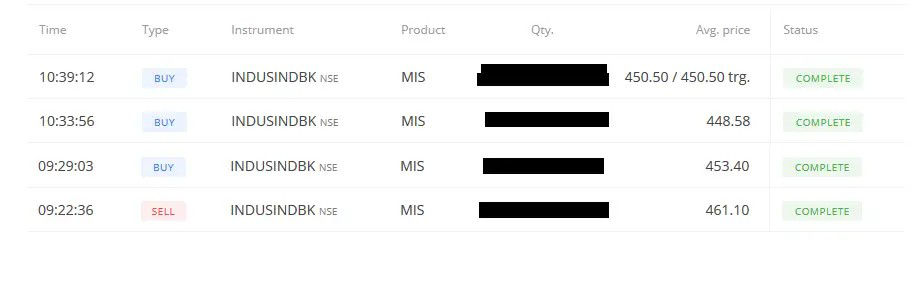
All these indicate bearishness. So sold in next candle. As shown in the below image


Mr M.


Comments
Post a Comment