Option Chain Analysis in Trading
1 What is Option Chain Analysis in Trading?
2 What is open interest?
3 How to study option chain table
4 The element of the option chain table
5 How to interpret option open interest
6 Use of open interest
Market Structure Principles
Price moves within a structural framework of the supply and demand zone. A breakout of the structural framework supply and demand zone will lead to price movement in the next area of the framework of the supply and demand zone

OPTION CHAIN COMPONENT

WHAT are ITM (IN THE MONEY) OPTIONS?
A call option is said to be in ITM if the strike price is less than the current spot price of the security.
A put option is said to be ITM if the strike price is more than the current spot price of the security.
What are ATM (AT THE MONEY) OPTIONS?
A call option is said to be in ATM if the strike price is equal to the current spot price of the security.
A put option is said to be ATM if the strike price is equal to the current spot price of the security.
WHAT are OTM (OUT OF THE MONEY) OPTIONS?
A call option is said to be in OTM if the strike price is more than the current spot price of the security.
A put option is said to be OTM if the strike price is less than the current spot price of the security.
Open interest
How Changes in Open Interest Occur
If both participants in trade are initiating a new position, the open interest will increase. If both participants are liquidating an old position, the open interest will decline.
If, however, one participant is initiating a new trade while the other is liquidating an old trade, open interest will remain unchanged.
Misconception about open interest
Never think that since the PRICE is rising, more LONGS are being created than SHORTS. LONGS will always be equal to SHORTS just that LONGS are dominating SHORTS in the transaction, that is why PRICE is rising
The number of shares bought is ALWAYS EQUAL to the number of shares sold. Then why does the PRICE rise or fall? because of buying pressure or selling pressure. So, if buyers of a contract are dominating the sellers, PRICE will rise and if sellers are dominating the buyers, PRICE will fall. But BUYERS will always be equal to SELLERS. So, open interest is rising, which means new contracts are being added. But since PRICE is rising with it, it means that LONGS are DOMINATING the transactions. Thus, the market/share is STRONGLY BULLISH. Opposite of bearish trend
WRITING/Selling(Sellers) is more important here….. Why…?
It takes conviction to sell as there is Unlimited risk and more money required
Sellers are usually someone with Big money like Big Institutions
Buyers are usually retail traders as it is convenient with the less required capital
Institutions are usually right
Large option open interest means a massive bet against that strike price

Use of open interest data
To identify support and resistance
To find out when support resistance will break
Direction of trend
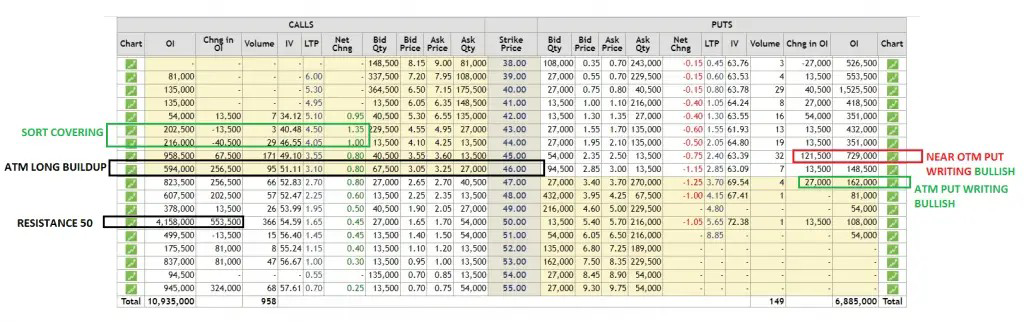
Identifying Support and Resistance based on option chain open interest

How do identify support and resistance levels or zone?
STEP 1 find the highest OI column on both sides (call and put side)
STEP 2 note the corresponding change in
Support biggest open interest number + positive change in open interest
RESISTANCE(CE) biggest open interest number + positive change in open interest

How to know where is the resistance in an all-time high price?
By analyzing the option chain data
PARTICULAR STRIKE PRICE in Option Chain Analysis
Now we will study what is a particular strike price showing us.
+ve change in OI implies that call writers are selling because they feel the stock will not rise above the respective level
-ve change in OI implies that call writers are squaring up because they feel the stock will rise above the respective level.
+ve change in OI implies that call writers are selling because they feel the stock will not rise above the respective level
-ve change in OI implies that call writers are squaring up because they feel the stock will rise above the respective level
“STRIKE PRICE” will show any of the following:
LONG BUILDUP
LONG LIQUIDATION
SHORT BUILDUP
SHORT COVERING
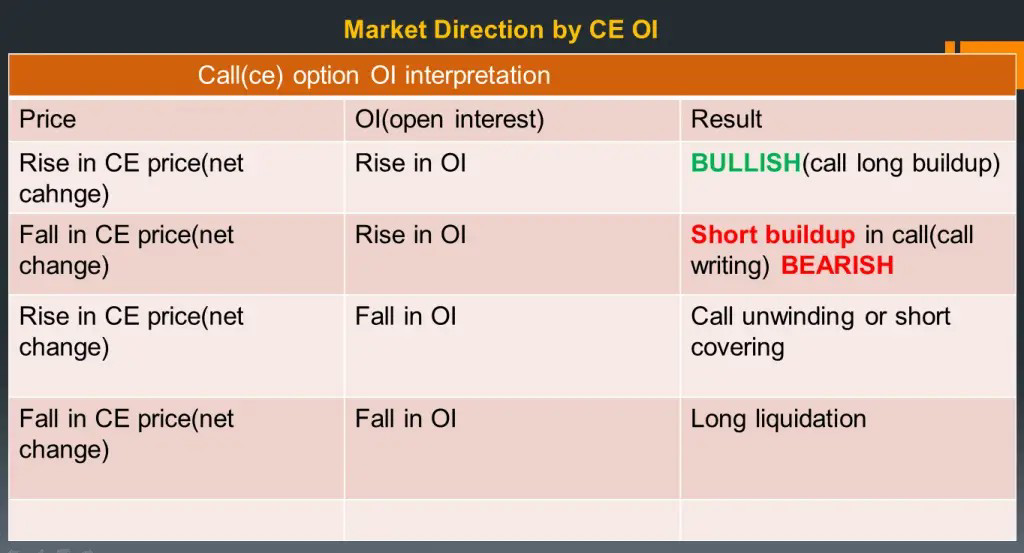
LONG BUILDUP in Option Chain Analysis
If the PRICE is rising and open interest is rising, it means the market is STRONGLY BULLISH. LONG BUILDUP
If PRICE and OI both are rising, it means that the new contract that is being added is dominated by bulls, that’s why PRICE is rising with every new contract addition.
Short-covering in Option Chain Analysis
If the PRICE is rising but open interest is falling, it means the market is WEAKLY BULLISH. Short covering
If the PRICE is rising but open interest is falling, it means that the rise in price is due to SHORT COVERING and not bullishness. See why is OI falling? It’s falling because positions are being squared off and the number of open contracts in the market is reducing. But since PRICE is rising with it, it means that SHORTS are SQUARING OFF and dominating LONGS in the transaction. See, how would SHORTS square off? They will square off by BUYING. That is why PRICE is rising. So, PRICE is not rising because LONGS are dominating. It is rising because SHORTS are dominating the squaring-off process. Thus, it can not be called BULLISH. It is WEAKLY BULLISH. It can be a TRAP for new LONGS.
Rally Extrapolating from the general rule, price up with high volume is bullish. However, if open interest drops during this same trading session, a bearish reading of that variable results. The internal condition of the market during such a trading session would be that of short covering. A short-covering rally is a very weak technical situation. The technician can state that the decline in open interest is more bearish than the high volume is bullish. In fact, if the volume is so high that it can be considered to be of blowoff proportion, the volume reading would also be bearish- signaling at least a temporary reversal of the price uptrend
SHORT BUILDUP in Option Chain Analysis
If the PRICE is falling, open interest is rising, the market is STRONGLY BEARISH.
If the price is falling and open interest is rising, it means that SHORTS are dominating the LONGS. And since open interest is rising, it means that new contracts are being added. But, since the price is falling, it means the new contracts which are being added are dominated by SHORTS, not LONGS. Hence, it is STRONGLY BEARISH.
LONG LIQUIDATION in Option Chain Analysis
If the PRICE is falling and open interest is falling, the market is WEAKLY BEARISH.
If PRICE is falling and open interest is falling, it means that the fall in price is due to LONG COVERING or also called LONG UNWINDING. See why is open interest falling? It’s falling because positions are being squared off and the number of open contracts in the market is reducing. But since PRICE is falling with it, it means that LONGS are SQUARING OFF & dominating SHORTS in the transaction. how would LONGS square off? They will square off by SELLING. That is why PRICE is falling. So, PRICE is not falling because SHORTS are dominating and creating new positions. It is falling because LONGS are dominating the squaring-off process. Thus, it can not be called BEARISH. It is WEAKLY BEARISH. It can be a TRAP for new SHORTS.
MARKET DIRECTION BASED ON OPTION OI
In which direction both support and resistance are shifting. If both shiftings are higher is indicated bullishly
HOW TO KNOW?
BY CHANGE IN OPEN INTEREST IN PARTICULAR STRIKE PRICE
Let’s study call open interest (CE OI)

Let’s discuss putting open interest (PE OI)


Lets combine both calls and put
Call writer adding(increasing) and put writer exiting(decreasing)=bearish
Put buyers adding(increasing) and call buyers exiting(decreasing) = bearish
Call writer decreasing(exiting)and put writer adding(increasing)=bullish.
Call buyers increasing(adding) and put buyers decreasing (exiting )=bullish

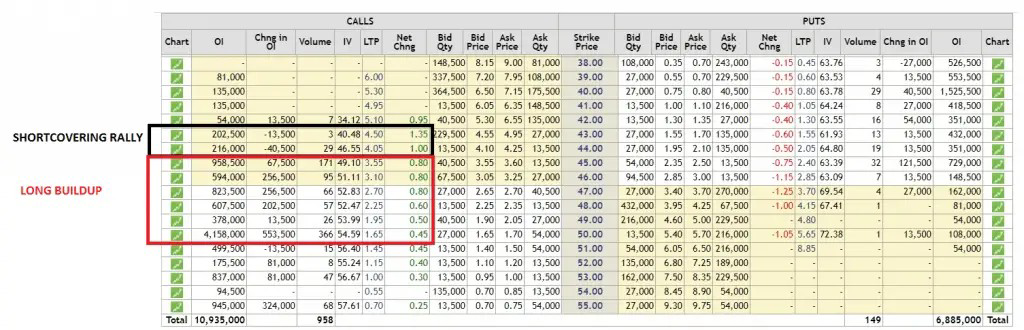
OPTION CHAIN TABLE FOR ABOVE CHART
WHAT HAPPEN NEXT

Let’s see the option chain data for this chart

BREAKOUT/REVERSAL
Let’s study bullish breakout and Bull-to-bear reversal
REVERSAL STUDY
If near CE OTM strike price has the highest open interest and positive change in open interest, then the price will not break that level. means call writers to feel that the price will not move above that level
PUT WRITER exiting means open interest decreasing in ATM and ITM PE, THEY FEEL THA PRICE WILL MOVE BELOW THAT LEVEL
BREAKOUT STUDY
If near CE OTM strike price has changed in negative open interest, then the price will break that level. call writer is exiting means they are feeling the price will move up
The addition of ATM AND ITM PE means put writers are bullish

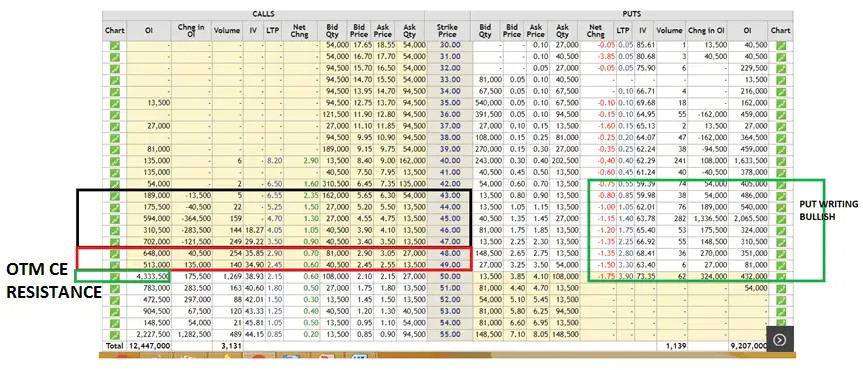

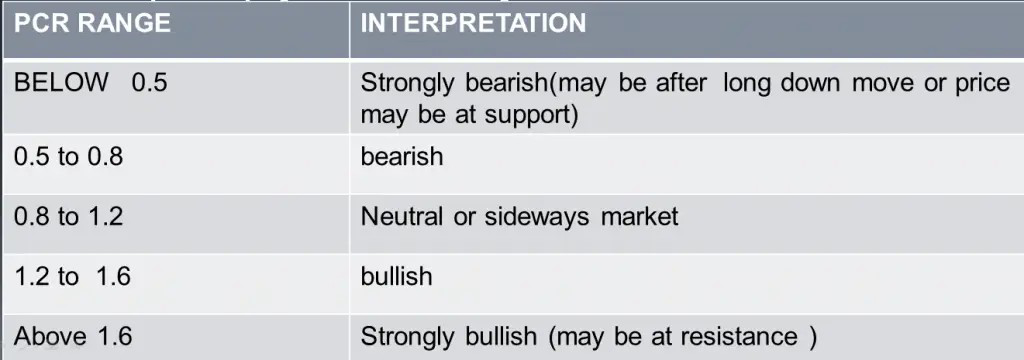
Put call Ratio (PCR)
HIGH PCR =BULLISH
More puts than calls
Big sellers are selling puts, more than calls
This means they are saying the market won’t go down much
Please watch the following video if you want to learn and understand the Option Chain Analysis in Trading concept in a better way.
Mr M


Comments
Post a Comment