Posts

Showing posts from August, 2023

How to Read Candlestick Charts for Intraday Trading

Image
How to Read Candlestick Charts for Intraday Trading Intraday trading is a method of investing in stocks where the trader buys and sells stocks on the same day without any open positions left by the end of the day. Hence, intraday traders try to either purchase a share at a low price and sell it higher or short-sell a share at a high price and buy it lower within the same day. This requires a good understanding of the market and relevant information that can help them make the right decisions.                                                                      In the stock market, the price of a share is determined by its demand and supply among other factors.Charts. Tools such as candlestick chart patterns offer great help to traders. We will talk about these Candlestick Charts and offer steps to help you read the...

Option Chain Analysis in Trading

Image
1 What is Option Chain Analysis in Trading? 2 What is open interest? 3 How to study option chain table 4 The element of the option chain table 5 How to interpret option open interest 6  Use of open interest Market Structure Principles Price moves within a structural framework of the supply and demand zone. A breakout of the structural framework supply and demand zone will lead to price movement in the next area of the framework of the supply and demand zone OPTION CHAIN COMPONENT WHAT are ITM (IN THE MONEY) OPTIONS? A call option is said to be in ITM if the strike price is less than the current spot price of the security. A put option is said to be ITM if the strike price is more than the current spot price of the security. What are ATM (AT THE MONEY) OPTIONS? A call option is said to be in ATM if the strike price is equal to the current spot price of the security. A put option is said to be ATM if the strike price is equal to the current spot price of the security.  WHAT are ...

Intraday Open High Open Low Trading Strategy

Image
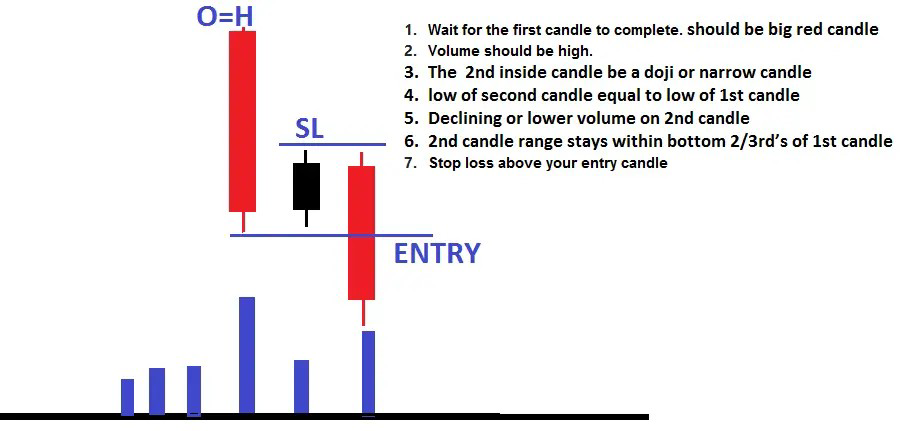
  OPEN HIGH LOW STRATEGY  Intraday Open High Open Low Trading Strategy The original name of the strategy is open deive. From a buy-sell perspective, we called it open high and open low. Open high= sell Open low= buy So open rive and open high open low are both the same. The logic behind the strategy These are directional moves with strong hand participation and conviction. Where does it occur? Location It occurs most of the time after a sideways price action (tight price channel), or You can also spot it at the start of a trading session. From a strong supply or demand zone If open-drive occurs after a sideways price action, it indicates that either strong buyers or sellers were accumulating their positions in the sideways price action, or afterward, they started aggressive buying or selling activity to move the price If at the start of a trading session. An Open-Drive is generally caused by participants who have made their market decisions before the opening bell. The market ...